Human-Caused Global Warming? How Do You Prove It Scientifically ?
How exactly does one measure "global warming?" Where is the rectal thermometer inserted? I would love to get my hands on that data file that "proves" that there is human-caused global warming! Are the data from randomly selected points on the earth? Are all points on the earth equally likely to be selected? If a randomly selected point is inside a shopping mall on July 4th, is the temperature inside the mall taken or is the temperature outside next to the a/c machine taken? If the random point is outside the window of an airport terminal in winter, is the heat inside the terminal turned off, so that heat leaking out of the window does not contaminate the measurement?
Scientists at NASA can not find
any "global warming" human caused or otherwise as such from satellite
data which measures all points on the earth and averages it out:
http://science.nasa.gov/newhome/headlines/essd06oct97_1.htm
I
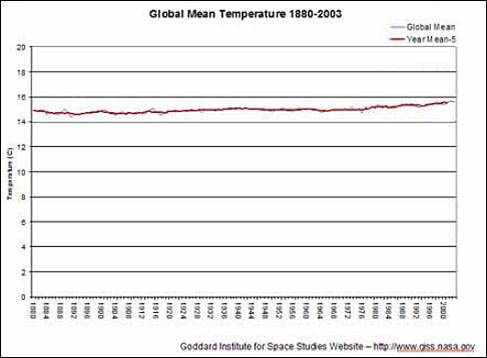
would love to see how each data point for the first graph below was collected. To be done scientifically, at least 400
points on earth have to be randomly chosen in 1880 and tracked with the same
thermometric device over the 124 years, measured at the same randomly chosen
time of day. I notice the error bars get smaller over time, is that
due to increased amounts of CO2? They must have more data points in 2004
than in 1884. Why? Are the measurements taken at the same
locations? Same measurement conditions? Same temperature
device? If the points are on the oceans, are volcanic hot
spots and their variability taken into account? Is solar output
variability (sun spot cycles) an adjusting factor? Do they now have more
thermometers in the
If
carbon dioxide was increasing uniformly since 1850, why is there a temperature
plateau between 1945 and 1985? Probably
because CO2 is such a lousy greenhouse effect gas compared to water vapor or
methane:
http://www.clearlight.com/~mhieb/WVFossils/greenhouse_data.html
Why
is the variability in the 1940s so much more than in the 1960s? Selected data? The 1883 Krakatoa eruption decreased the
earth's temperature by 1.2 degrees C through
1884. It does not show up on this graph. Why not? The 1991 Mt
Penatubo eruption cooled the entire earth by 0.4 to 0.5°C. It does
not show up on this graph. Why not? The graph starts in 1880. Thermometers
were invented 300 years ago. Why the selected data?

If you do not want to
lie with statistics, here is the same graph to scale:
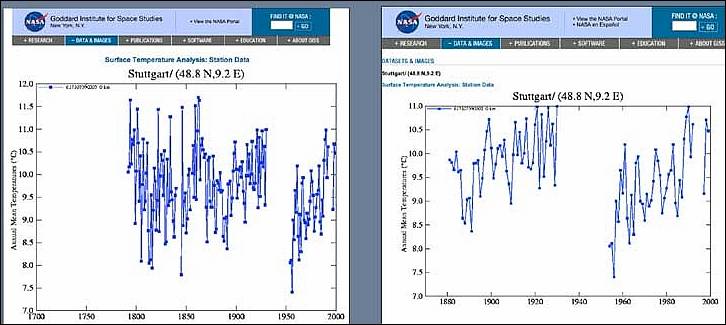
Even Goddard space flight
is not beneath lying with statistics if it gets them more global warming
research money (note how they too use Bernie Sanders statistics and select the
years to "prove" a warming trend (note the change from 2004 on the left
to 2005 on the right):
There is
global warming if you think that the earth scientists are right about the last
ice age and the Little Ice Age. After all most of the earth's glaciers melted
and raised the ocean levels 400 feet already long before the Industrial
Age. During the Little Ice Age, towns in the